If you wish to get a simple but interactive line graph of multiple tetrahedra in 3-dimensional space, here’s a hack.
Without wasting much time, let me show the code. It is assumed that you have a points array (3-dimensional), containing the list of points in 3D space. Let’s construct one such array (integers from 0 to 9 in all dimensions):
import numpy as np
points = []
for i in range(10):
    for j in range(10):
        for k in range(10):
            points.append([i,j,k])
points = np.array(points)
Now, let’s assume that we have another list: tetra_list, containing the vertices for the tetrahedrons.
For example, if an element of my tetra list is [1,3,5,10], it means that the corresponding tetrahedron is constructed using the points at index 1,3,5, and 10 in the points array.
Let’s keep a short 3-element tetra_list for now:
tetra_list = [[1,961,708,114],
              [245,432,645,360],
              [151,511,812,344]]
Now let’s plot it out, using different traces of plotly graph_objects
import random
import plotly.graph_objects as go
fig = go.Figure()
for i in range(len(tetra_list)):
tetra = tetra_list[i]
X = list(points[tetra][:,0])
Y = list(points[tetra][:,1])
Z = list(points[tetra][:,2])
X.extend([X[0],X[2],X[1],X[3]])
Y.extend([Y[0],Y[2],Y[1],Y[3]])
Z.extend([Z[0],Z[2],Z[1],Z[3]])
fig.add_trace(go.Scatter3d(
x=X, y=Y, z=Z,marker=dict(
size=4,
),
line=dict(
color='rgb(' + str(random.randint(0,255))+',' + str(random.randint(0,255))+',' + str(random.randint(0,255))+')',
width=2
)
))
fig.update_layout(
showlegend=False,
plot_bgcolor="white",
)
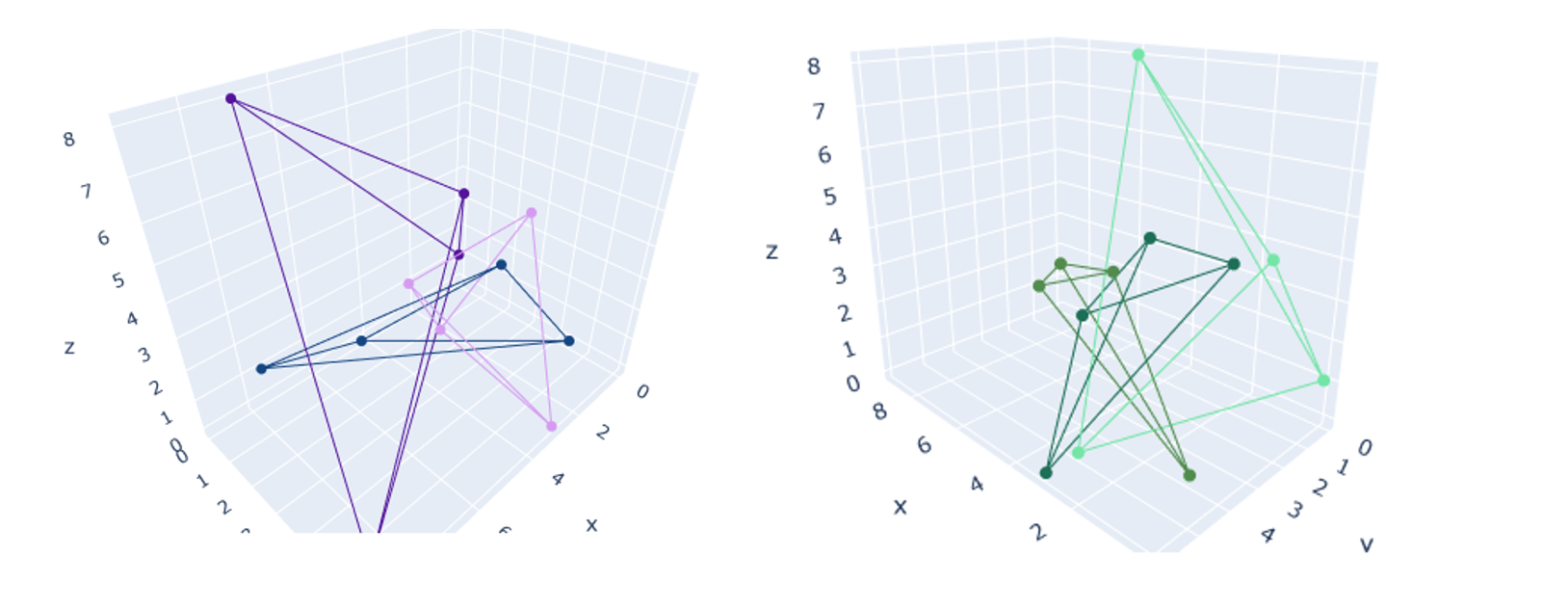
fig.show()As you can see, we are using random numbers for generating the colors. This will help us differentiate between the tetrahedra. The result?
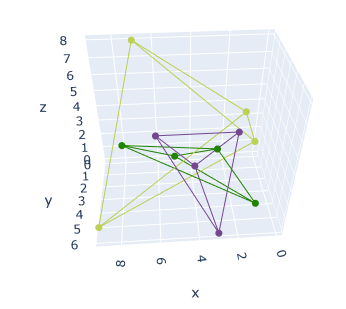
The interactive version of the above can be found here.
Pay attention to the X.extend([X[0],X[2],X[1],X[3]]) line. What are we doing here? We are basically saying that if I am an ant traveling along the tetrahedron’s edges, and I wish to traverse through all the edges, what path will I take?
If my points are numbered 0,1,2,3, then one possible option is this: I’ll start at 0 and go from 0 -> 1, then 1-> 2, then 2-> 3. This part gets covered in the X = list(points[tetra][:,0]) line. Next, I’ll go from 3 -> 0, 0 -> 2, 2 -> 1 and 1 -> 3. This is achieved through the X.extend([X[0],X[2],X[1],X[3]]) line. This way, I’ll pass through all the edges at least once. Only the 1 -> 2 edge is repeated once. All others are traversed a single time. This doesn’t affect the visualization luckily.
You can keep adding more and more tetrahedrons to the tetra_list. This can be a useful tool to visualize the output of 3D delaunay triangulation.
I hope you liked this article. Check out other articles on python on iotespresso.com.