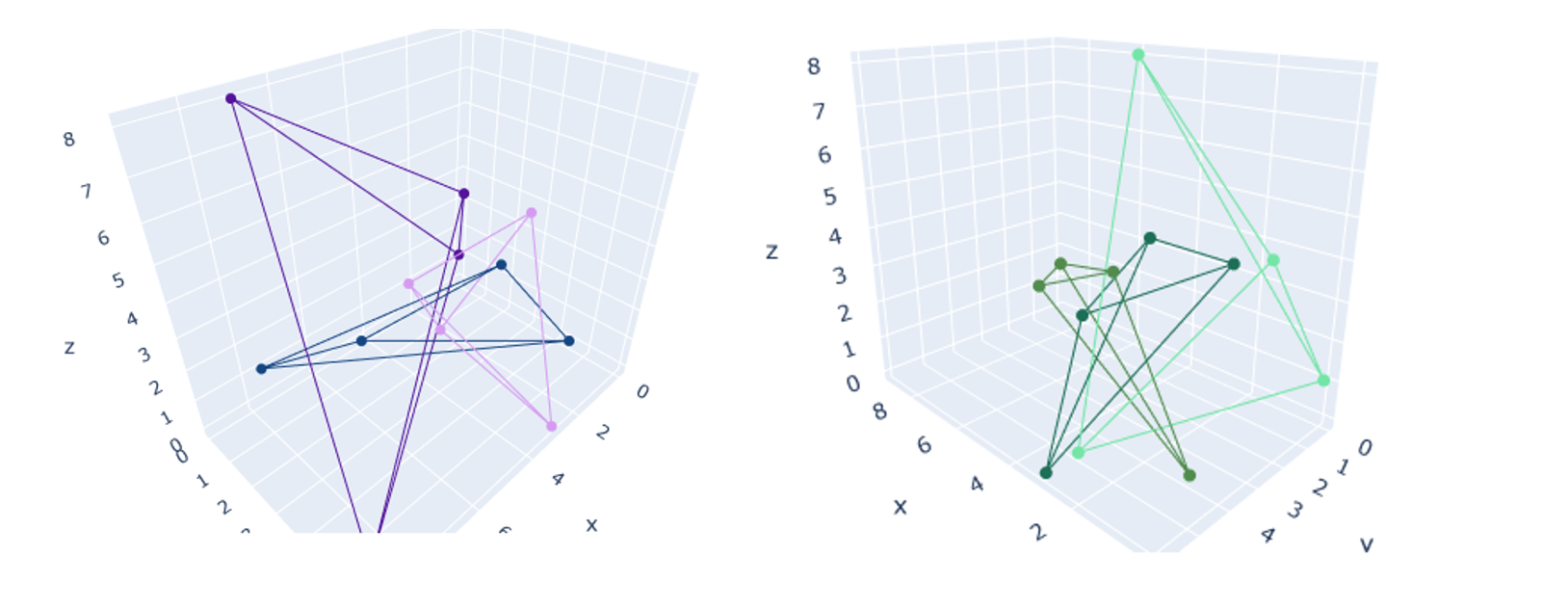
Learn how to visualize multiple tetrahedra in the 3D space using plotly graph_objects’ scatter3d function. This can help visualize 3D delaunay triangulation.
Tag: plotly
How to change the plot size: Matplotlib, Seaborn, Plotly
Learn different ways for changing the figure size in matplotlib, seaborn and plotly. Bookmark this page for future reference.
