If you have a dash app with timer callbacks, or any other callbacks, containing some plotly visualizations, you may have discovered that as soon as the timer callback is triggered, your plotly visualizations get reset. This is annoying if you have zoomed in to a specific section of the plot to make some observations, and suddenly the zoom level is reset.
In order to avoid this, dash core components, in 2018 (release 0.39.0), came out with the uirevision property. It needs to be added to the layout property of the figure property of dcc.Graph.
What does it do? It acts like a single indicator to dcc.Graph on whether the user interactions (zoom, pan, filter, clicks, etc.) need to be reset or not. Basically, before the uirevision property was introduced, dcc.Graph used to be like ‘The figure property has updated, so I should reset the UI and show the new figure’. Now, after the uirevision property, dcc.Graph is like ‘The figure property has updated. But has uirevision property been updated? No? Then I’d rather not reset the user actions.
Implementing this property is quite straightforward.
All you need to do is add this property in the fig.update_layout function, whenever you are updating the fig. The code snippet below is taken from a previous tutorial on Deploying a dash app with timer callbacks on Heroku. Focus on the .update_layout function.
#Callback to update the line-graph
@app.callback(Output('plot', 'figure'),
              [Input('intermediate-value', 'children')])
def update_realtime_fig(json1):
    df_go = pd.read_json(json1, orient='split').tail(500)
    fig = make_subplots()
    fig.add_trace(go.Scatter(x=df_go['time'], y=df_go['rate'],
                        mode='lines+markers',
                        name='Devices'))
    fig.update_layout(
        title_text="Rate in last 100 readings", uirevision="Don't change"
    )
    fig.update_yaxes(title_text="Rate", secondary_y=False)
    return fig
Over here, I’ve set the value of uirevision to ‘Don’t change’. You can set it to anything. It can as well be ‘The Jamestown colony of Virgina’. The value of uirevision doesn’t matter. What matters is the change. If this value changes at any point, the user interactions will be reset as soon as the figure updates.
Now, you may be wondering what happens if you have zoomed in on a specific point and, after the figure gets updated, the point is no longer there. Will the figure then be reset? No!
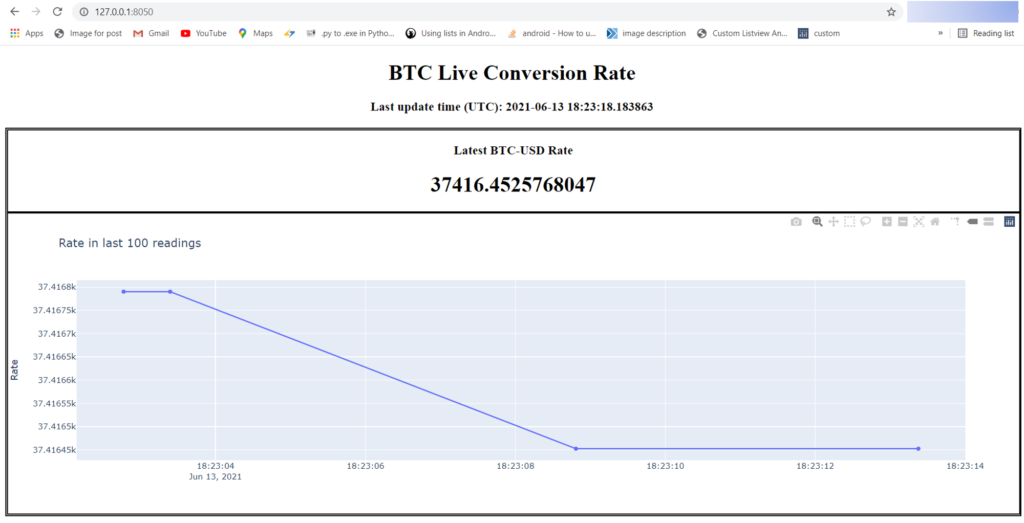
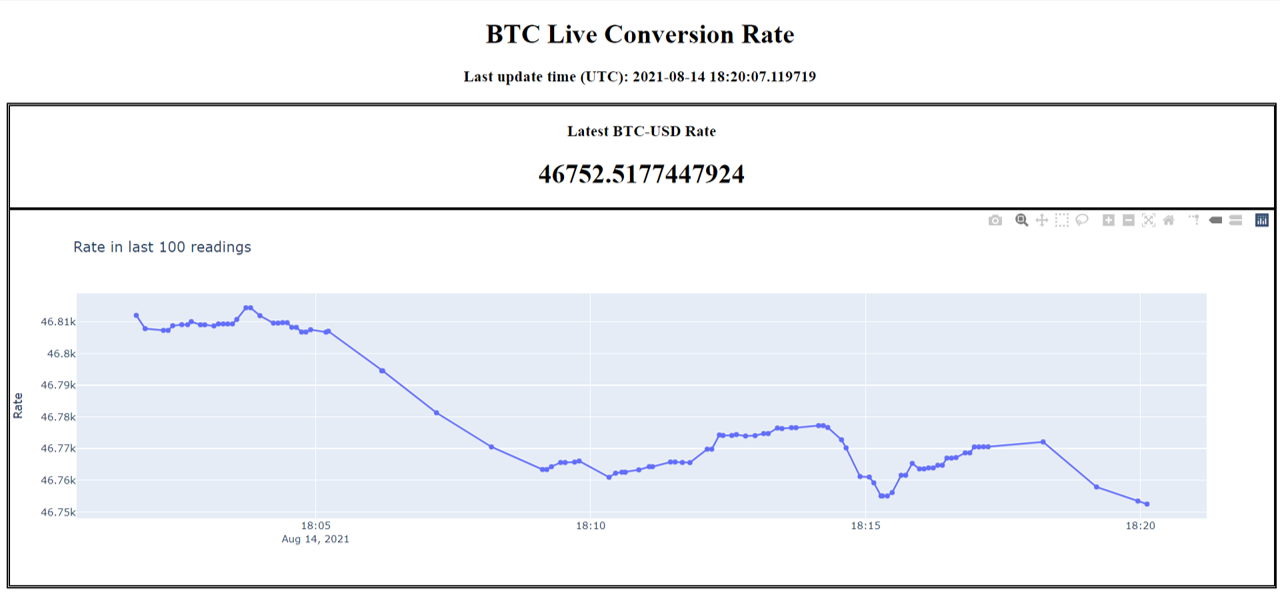
Let’s understand this with an example. In the previous tutorial that I referenced above, we created a simple app that tracked the live price of Bitcoin. This is how the UI looked like:

As you can see, the plot shows only the latest 100 readings at any point in time. So what would happen if you had zoomed in on the leftmost section, and then, after a couple of callbacks, those points are no longer a part of the figure?
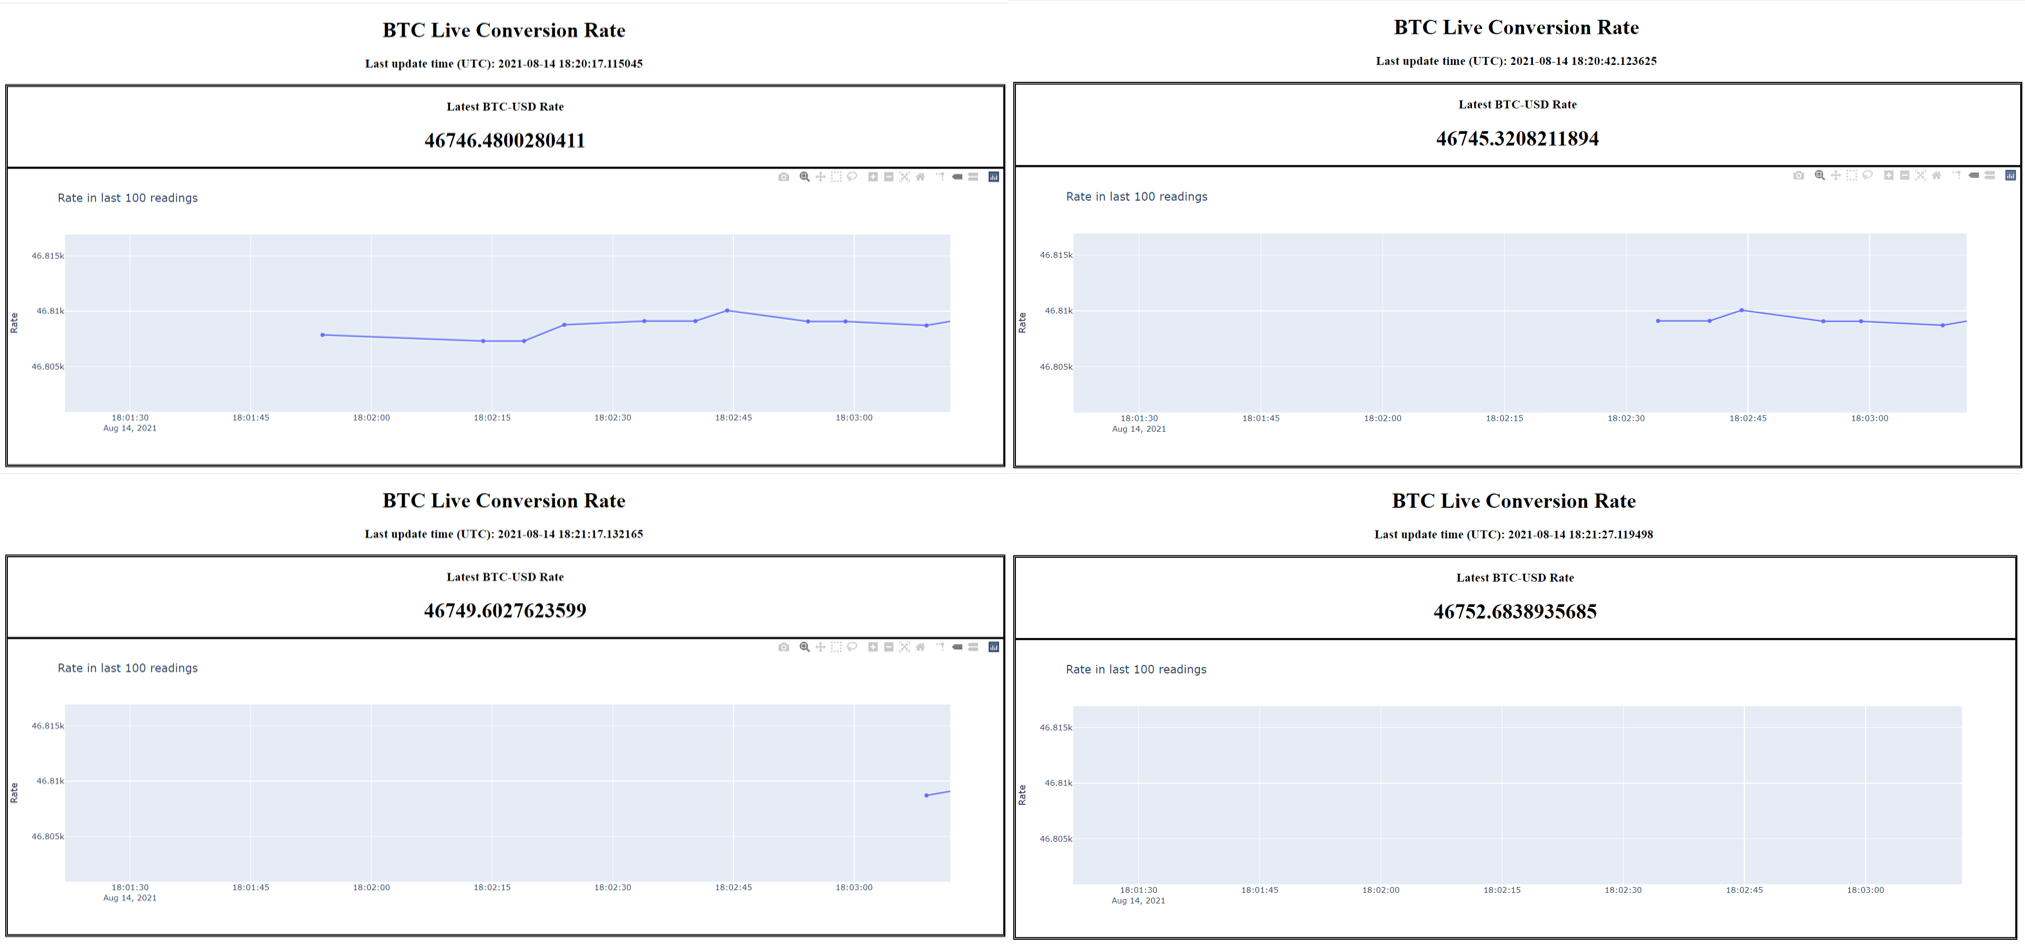
I tried that. These were the results:


As you can see, the number of points in the zoomed region kept reducing as the figure updated (since it was showing only the latest 100 points), and eventually, the view turned empty. But dash did preserve the zoom settings. Basically, because uirevision property wasn’t changing, dash said:
‘As per the user’s actions, I need to show points with X between 18:00:45 and 18:03:15, and Y between 46.8K and 46.82K).’
With each figure update, the points in this box kept reducing, but dash remained loyal to the user-defined view. The user can of course reset the view using the control buttons at the top right of the plot, but dash won’t do that by itself, given that uirevision didn’t change. So, a pretty cool and helpful feature. Don’t you agree?
If you wish to explore Plotly and Dash further, you will find this Udemy course to be very helpful.
Also, please check out other posts on Python on check out further posts on iotespresso.com.
1 comment