Introduction (What we’ll build)
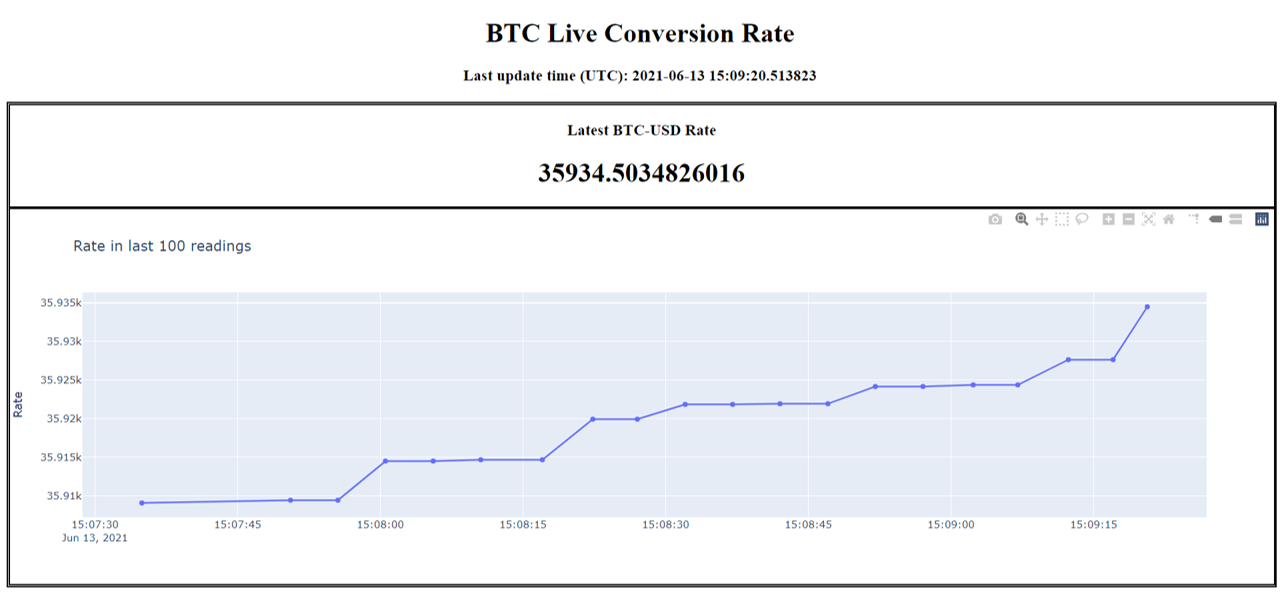
We’ll create a very simple dash app with timer callbacks, and deploy it on Heroku. Data keeps getting refreshed periodically (without the need for clicking any buttons), giving it the ‘live’ feeling. To be very specific, this is what we will build (the live URL is given below and the screenshot is provided in the featured image):
https://btc-live-conversion-rate.herokuapp.com/
As you can see, this is a live Bitcoin price tracker. It gets updated every 5 seconds. The last update time is shown, along with the latest price. The price trend in the last 100 readings is shown in the form of a line chart.
Prerequisites
It is presumed that you are proficient in python. Familiarity with Plotly and Dash will help. If you are unaware, plotly is a library for creating interactive visualizations in Python and dash is a library for creating interactive dashboards using python, which supports all plotly visualizations. You can read more about them here: https://plotly.com/dash/. Essentially, plotly and dash help Pythonistas create fun, interactive dashboards without any frontend knowledge.
We will be using Heroku to host our dashboard. It is assumed that you have a Heroku account. Otherwise, you can create a free account by clicking here.
Code Walkthrough
We are using the API from CoinCap to get info on the Bitcoin price. You can try entering the following in your browser, to visualize the API response: https://api.coincap.io/v2/rates
Disclaimer: This tutorial was created in June 2021. If there are any updates to the above API and/or it stops working in the future, please let me know in the comments. I’ll update the tutorial.
Let’s begin the code walkthrough. The code can be found on GitHub here: https://github.com/yash-sanghvi/live-btc-tracker
The live_btc_tracker.py file is the file of interest.
Imports
The file begins with the import of all the libraries of interest.
The dash_html_components is concerned with the standard HTML elements and the dash_core_components is related to all the Dash-specific elements (graph, interval, etc.) Input, Output, and State are used for defining callbacks. We’ll see their usage shortly.
The plotly imports are primarily for the line chart. The other imports are some common Python libraries.
Initial Data Prep
Next, we prepare the initial data, by making a call to the API, extracting the price of BTC, and storing it, along with the timestamp, in a dataframe.
HTML Layout
We now create the dash server and define the HTML layout. Refer to the screenshot of the dashboard in the featured image. It will help in understanding the elements of the HTML layout.
The following points are worth noting:
- Every HTML element that needs to be updated is provided with an ‘id’. This id is important for referencing it later in the code.
- The dcc.Interval component dictates the refresh interval. You can read about its arguments in the documentation.
- There is an HTML div with ID ‘intermediate-value’ at the end. Notice the ‘display’: ‘none’ attribute in the style. This means that this is a hidden element. This element is used for storing the data that will be accessed by the other visual elements of the dashboard. We will see its usage in the callback.
- The df_line dataframe we created in the initial data prep section is used for initializing the ‘intermediate-value’ div.
Callbacks
Now let’s have a look at the callbacks. There are 4 callbacks in total.
- The first callback updates the hidden ‘intermediate-value’ element with the latest data
- The second callback updates the ‘last_update_time’ element
- The third callback updates the ‘rate’ element with the latest price of the bitcoin
- The fourth callback updates the line chart
The first two callbacks are triggered every 5 seconds, by the dcc.Interval() element. Technically, the change in ‘n-intervals’ property of the dcc.Interval() element triggers the callbacks. The ‘n-intervals’ property is updated every 5 seconds.
The next two callbacks are triggered whenever the data within the ‘intermediate-value’ element changes (again, every 5 seconds). In other words, whenever the ‘children’ property of ‘intermediate-value’ element updates, it triggers the third and fourth callbacks. The code below will make all this clear.
As you can see, each callback function is preceded by the @app.callback() decorator. This specifies which property of which element will be updated by the output of the callback function, and which property of which element will be the input. Whenever the input property changes, the callback is triggered. Take the first callback’s decorator for example.
@app.callback(Output('intermediate-value', 'children'), [Input('interval-component', 'n_intervals')],
              [State('intermediate-value', 'children')])
Over here, the ‘n-intervals’ property of the ‘interval-component’ acts as the input, and the ‘children’ property of the ‘intermediate-value’ element acts as the output. Therefore, whatever the function returns will be reflected in the ‘children’ property of ‘intermediate-value’. We require an additional input for this function: the current value stored in the ‘children’ property of ‘intermediate-value’, since we want to add to it. Therefore we fetch it using State(). Whatever you pass to the callback function using State() is extra information essentially. It doesn’t trigger the callback when the value changes.
Since this decorator has two inputs, the corresponding function also has two input arguments, in the same order as in the decorator
def clean_data(value, json_old):value corresponds to the value of ‘n_intervals’ property of ‘interval-component’, while json_old corresponds to the value of ‘children’ property of ‘intermediate-value’.
The other callbacks will now become self-explanatory. For the line chart, you can explore other arguments of plotly.graph_objects by reading the documentation. If you wish to explore the documentation specifically for the Scatter plot, click here. One property within update_layout (uirevision), is quite important and makes sure that your actions on the graph (zoom, pan, etc.) don’t get reset after each callback. You can read more about it here.
Running it locally
Finally, we add the following lines:
if __name__ == '__main__':
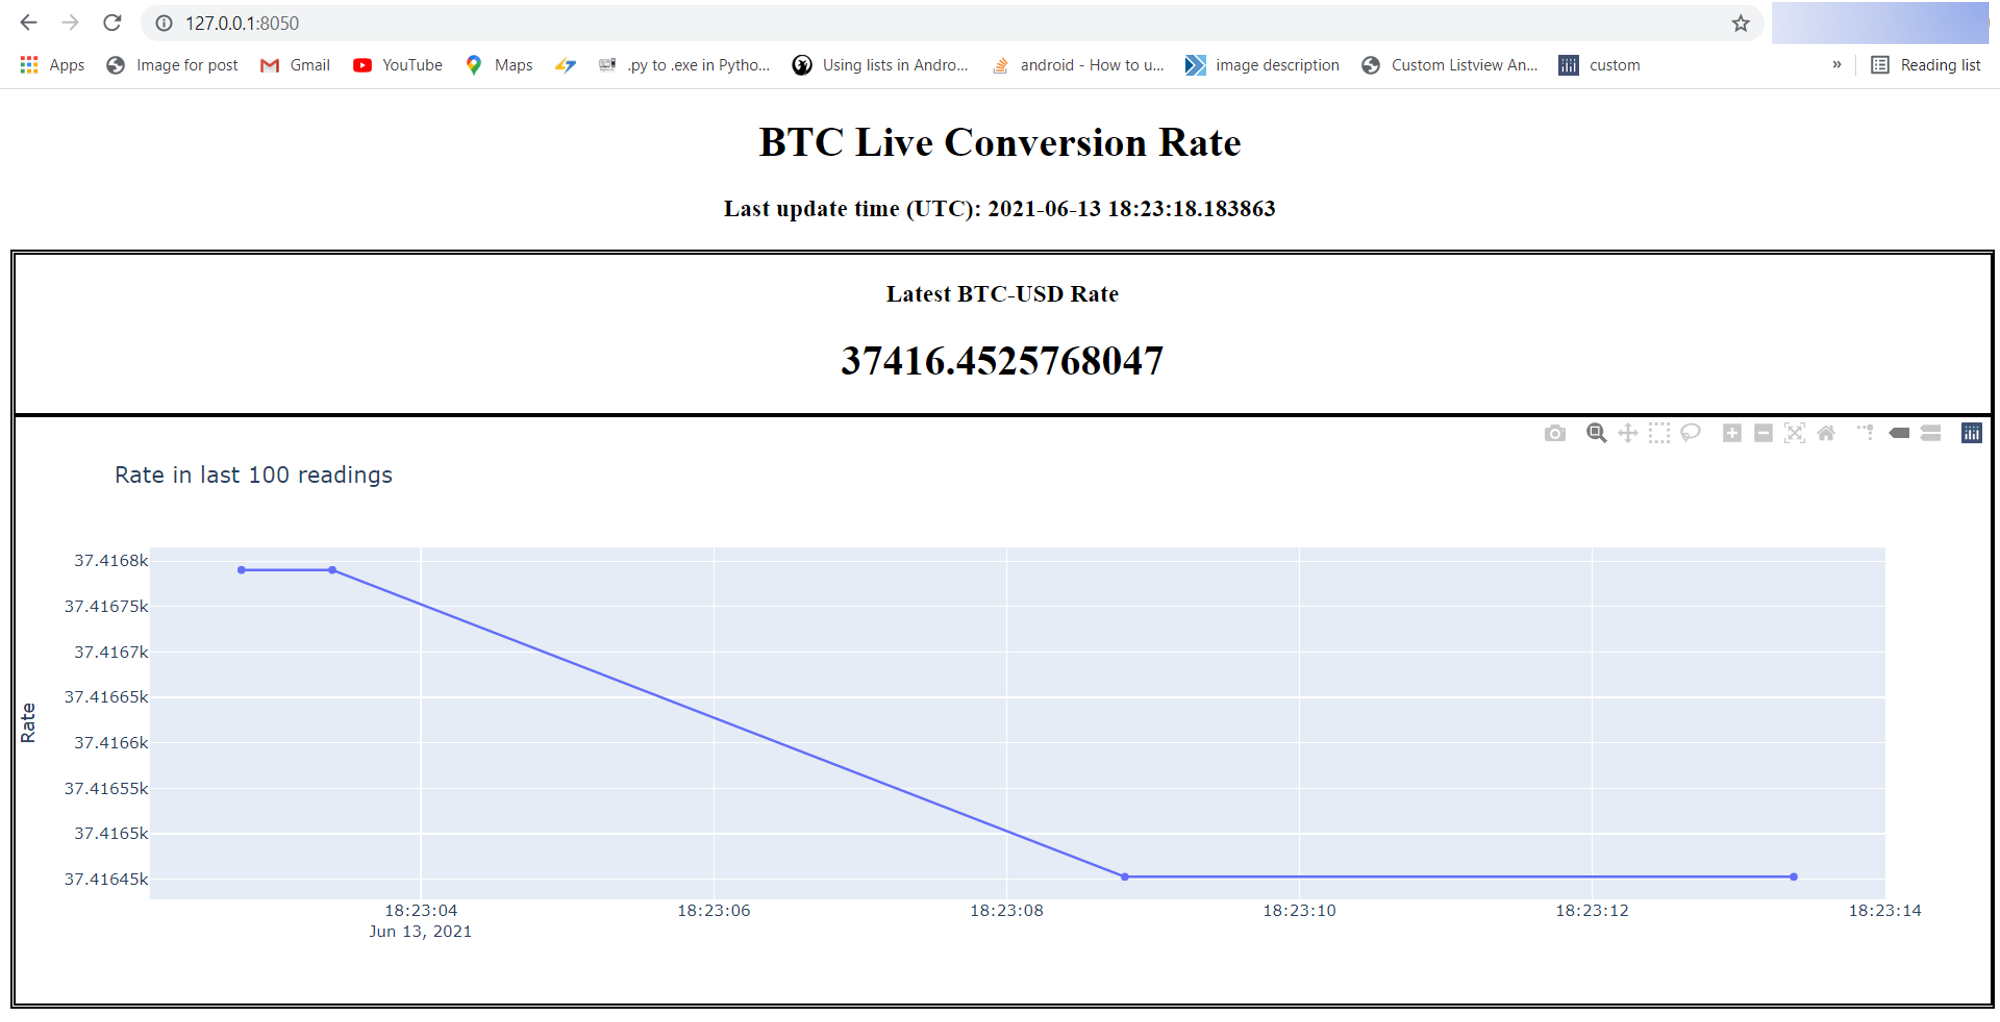
app.run_server()If you run this file locally, you will be given the localhost address wherein you can see the live dashboard in action. Most likely, the address will be http://127.0.0.1:8050/
Deploying to Heroku
Before deploying to Heroku, you need two additional files:
Procfile: This specifies that command that has to be run on startup. You can read more about it here. Our Procfile, as you can see in the GitHub repo, contains just this single command:
web: gunicorn live_btc_tracker:serverAs you can see, we are using the gunicorn HTTP server, and asking the Heroku dyno to run the server from the live_btc_tracker.py file.
requirements.txt: This tells Heroku what all dependencies have to be installed. This can be obtained by
pip freeze > requirements.txtYou can find the requirements.txt in the GitHub repo:
You can also optionally add a .gitignore file and list all the files that you need not push to Heroku. This is especially important if you have created a virtual environment while testing the app locally.
Once you are done with the above, open a Command Prompt or a terminal, and navigate to the folder containing your project files. Now, run the following commands:
heroku loginThis will prompt you to open a browser window and log in to your Heroku account. Once you are done logging in, run the following command:
heroku create project-nameReplace project-name with the name of your project. I named it btc-live-conversion-rate, and therefore, the URL is https://btc-live-conversion-rate.herokuapp.com/. You will need to select a unique name for your project, and you’ll get a URL accordingly. Once this is done, run the following commands, one by one:
git add .
git commit -m "Initial commit"
git push heroku master
This will push your files and build your project on Heroku. Once the build is complete, you can open the URL of your project and see it in action. If there are any errors in the build, you can check the heroku logs, by running
heroku logs --tailCongratulations on creating your first live dashboard using Dash, and deploying it on Heroku. If you want to learn how to add password protection to this dashboard, check out this article.
If you wish to explore Plotly and Dash further, you will find this Udemy course to be very helpful.
References
- https://dash.plotly.com/basic-callbacks
- https://plotly.com/python-api-reference/generated/plotly.graph_objects.Figure.html
- https://plotly.com/python-api-reference/generated/plotly.graph_objects.Scatter.html
- https://devcenter.heroku.com/articles/python-gunicorn
- https://plotly.com/dash/
Found this post helpful? Then check out further posts on iotespresso.com. Also, follow IoT Espresso on Twitter to get notified about every new post.
2 comments