
Introduction
So you have developed an end-to-end IoT system, consisting of the device, the backend, and the frontend. You tested it out with one device (or IoT node) and it works flawlessly. The transmission of data to the backend is seamless, and the response is received in a couple of milliseconds. Now you wish to check if the picture will be as rosy when you have a thousand IoT nodes instead of one. Will your backend be able to handle the traffic? How do you test it out? Creating a thousand IoT nodes right away, just for the load test, doesn’t seem economical. Then what should we do? The same thing that engineers do in such a situation: Simulate!
Luckily for us, we don’t need to create any separate software for performing this simulation. The people at locust.io have already done the heavy-lifting for us. In this tutorial, we will see how to use locust for performing load-testing of your HTTP IoT backend.
Getting Started
Installation
We’ll first start with the installation of Locust in python. Locust is a python package that gets installed via pip
pip install locustCreating a locustfile
Now, in order to simulate an IoT node, we need to create a class for our IoT node. It will be saved in locustfile.py. Let me first show the locustfile to you.
import random
from locust import HttpUser, task, constant_pacing

class IoTNode(HttpUser):
    wait_time = constant_pacing(5) #A gap of 5 seconds between each ping
    iot_id = random.randint(1,500)

    @task(10)
    def send_data(self):
        self.client.post("/data",json={"temperature":random.randint(1,100), "humidity":random.random()*100})

    @task
    def send_health(self):
        self.client.post("/health",json={"vbat":random.random()*5, "available_memory":random.randint(1,1024),"n_failed_req":random.randint(1,10)})

    @task
    def check_for_ota(self):
        self.client.get("/ota?id="+str(self.iot_id),name="/ota")


    def on_start(self):
        self.client.get("/greet?id="+str(self.iot_id),name="/greet")
Now, this may seem a bit overwhelming but it isn’t. Let’s break down the above code.
Understanding the locustfile
We have created an IoTNode class that inherits from the HttpUser class. Then, we define the wait time as a constant pace of 5 seconds. We are essentially saying that this particular node will perform a task every 5 seconds. What tasks will it perform? We’ve defined 3, with one task (send_data), having 10 times more weight than the other two. This means that the send_data task is 10 times as likely to get picked as each of the other two tasks. What request will be made, and to which path, is defined within each function. The base URL for the paths will be added later, during the simulation.
Thus, we are essentially simulating an IoT device that generally sends 10 data packets (each consisting of temperature and humidity values) to the server, followed by a health packet and an OTA check request. Of course, actual requests will not necessarily be in that order, but it will still be a very good simulation.
Finally, we have an on_start method that will be, as the name suggests, executed only once, during the start of the simulation. We are simulating the case when the device first pings to the server, and therefore, we have a greet method.
Note: The name argument in the API calls for check_for_ota and on_start tasks is used to club the endpoints together in the report generated by locust. Whatever the value of iot_id, the invocation should be club the API call within the group identified by the ‘name’ argument.
We have defined a very basic version of the locustfile here. It can, of course, be made much more powerful. You are encouraged to read the documentation on creating a locustfile.
Performing the Simulation
With the locustfile prepared, we will now begin our simulation. Open the terminal or command prompt on your machine and navigate the folder containing your locustfile.
In the command prompt, type locust
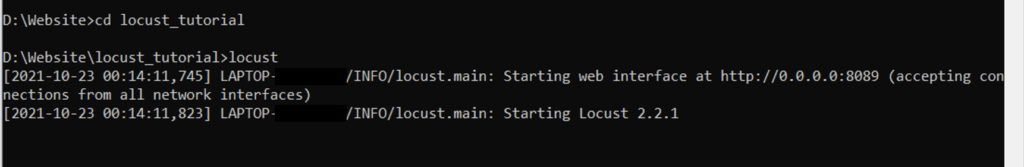
As you can see, it started the web interface on http://0.0.0.0:8089. Now, http://0.0.0.0 is essentially localhost. So, if the browser window doesn’t automatically open up, type localhost:8089 in a new browser tab. You will see the locust interface.

As you can see, it asks for 3 inputs from you, before starting the simulation:
- Number of users: This is the max number of users you want to simulate
- Spawn rate: This indicates the rate at which new users start. So if the number of users is 100, and the spawn rate is 10, then 10 new users will be added every second, till the count reaches 100.
- Host: This is the base URL for your APIs. For example, if you specify the host as http://www.example.com, then the send_data task will invoke http://www.example.com/data
Enter the 3 inputs, and then click on ‘Start swarming’. I’ll set the number of users to 100, and the spawn rate to 5. For the host, I’ll enter the base URL of the API Gateway I’ve created on AWS, connected to 4 lambdas, one for each API (you can enter the URL of your server, and also change the endpoints appropriately in your locustfile).
You should be able to see the Statistics dashboard, like the one below. You can stop the simulation once you have reached peak concurrency (100 users in this case) and the performance is stable for some time.
Understanding the results of the Simulation
This is what the Statistics dashboard looks like
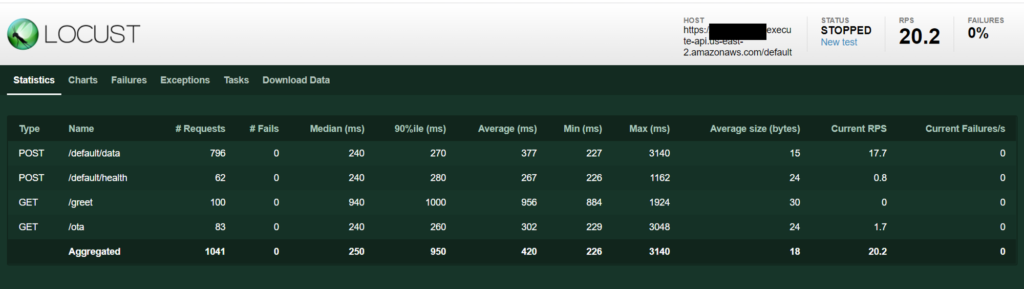
A couple of things to note:
- The RPS (requests per second) is 20.2. This is as expected. 100 users, each making one request every 5 seconds would lead to an avg. of 20 requests per second.
- The /data invocations are approx. 10 times more than /health and /ota. This again, is as per the expectations.
- The /greet endpoint was invoked only once for each user (so a total of 100 times). Again, as per expectations.
- The response time statistics (median, avg, min, max, 90%ile) are shown, and so is the average size, in bytes, of the response.
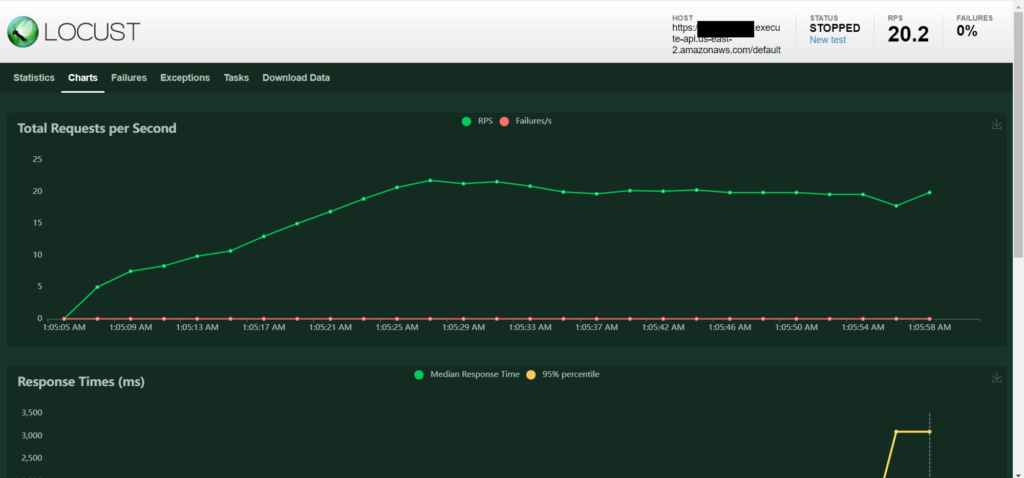
Apart from ‘Statistics’, there are several other tabs, each containing useful information about the simulation. The ‘Charts’ tab is particularly important. It shows the trend of RPS and the response time. If you see a sudden spike in either, that can be an indication that your server is getting overwhelmed. Thus, locust can help you determine the limits of your server very well.
Apart from these, it also shows the plot of number of users, which should generally increase linearly to peak concurrency, and then flatten out.
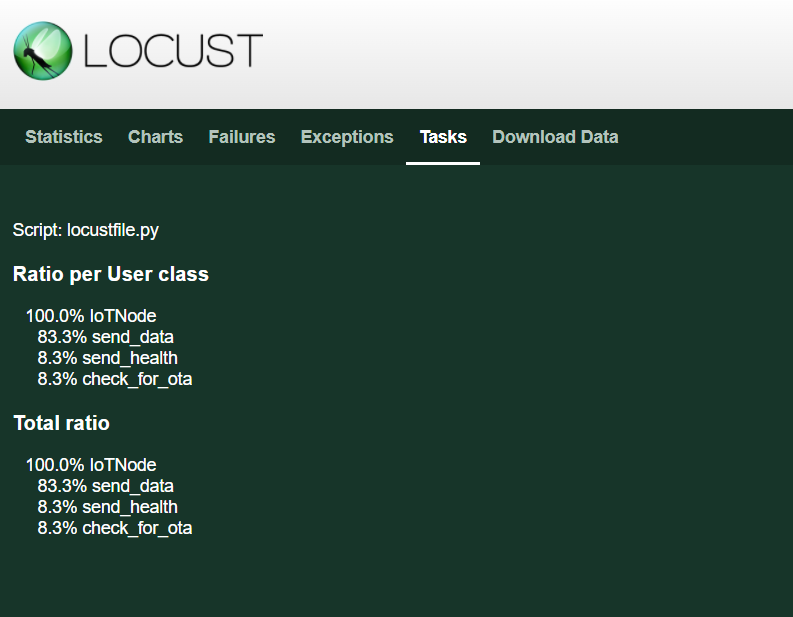
Apart from this, if any requests fail, their status codes and returned response will be shown in the ‘Failures’ tab. If the code in locustfile.py generates any exceptions, that’s recorded in the ‘Exceptions’ tab. The ‘tasks’ tab gives you a distribution of the requests per user class (we have only one), and also the overall distribution of requests.
Finally, the ‘Download Data’ tab allows you to download the various reports (Statistics, Failures, etc.) as CSVs.
Limits to the Simulation
You may be having a question at this point. How does locust actually work? Locust’s documentation provides some clues. Quoting locust:
When a test starts, locust will create an instance of this class for every user that it simulates, and each of these users will start running within their own green gevent thread.
Thus, each user is essentially a separate thread on your system, and each request is made using python-requests library. Thus, there are obvious limitations to how many requests locust can make per second, depending on the specifications of your machine. To give you an idea, on a 2018 MacBook Pro i7 2.6 GHz machine, you can have up to 850 requests per second. Locust provides a way to increase this number to 5000, using the FastHttpUser class. You can read more about it here.
If you want to simulate even more users, then you can go for multiple machines. See locust’s documentation on distributed load generation.
I hope you liked this article. If yes, then check out other articles on IoT on iotespresso.com. For any suggestions or feedback, do write a comment.
If you are interested in data science, visualization, and machine learning using Python, you may find this course by Jose Portilla on Udemy to be very helpful. It has been the foundation course in Python for me and several of my colleagues.