If you are using Dask, you may have used the .visualize() method to visualize task graphs. While the output of that method will be more or less sufficient for your own consumption, you may want to introduce some decorations, and/or customizations if you wish to present this task graph (say add it in a presentation or a report).
The task graphs of dask are generated using the Graphviz library, and therefore, most of the customizations available in Graphviz apply to these graphs. If you are on Windows and don’t have Graphviz installed, you can check out How to Install Graphviz on Windows.
Now, let’s create a visualization. I have a ~2 GB large file, containing lat lon data. I’ll read it in blocks of 600 MB, and try to find the min value of the df, and visualize its task graph. By default, the visualization will look like:
import dask.dataframe as dd
df = dd.read_csv('lat_lon_data.csv',blocksize='600MB')
df = df.min()
df.visualize()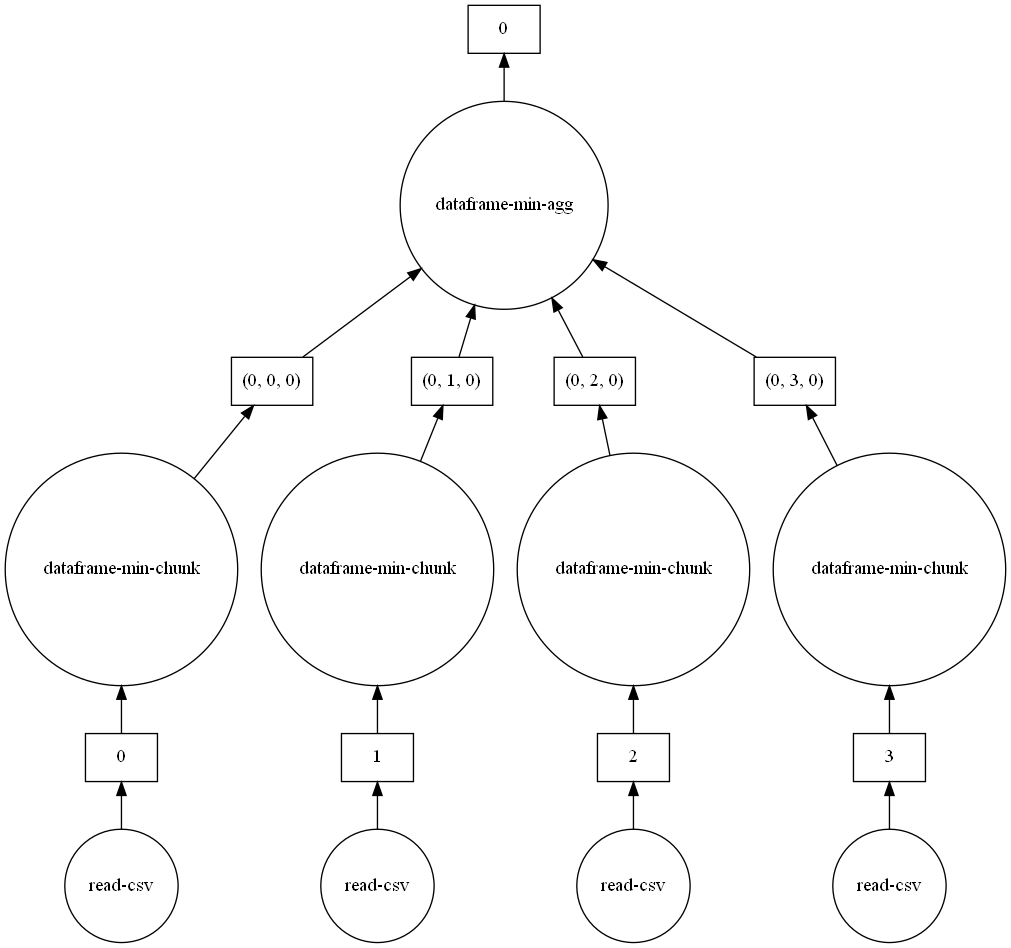
Now, let’s see an example of a customized/decorated version of this task graph:
df.visualize(node_attr={'fontsize':'50.0','fontname':'Arial',
                        'fontcolor':'red','style':'filled','fillcolor':'yellow',
                       'penwidth':'5.0'}, edge_attr={'penwidth':'5.0'})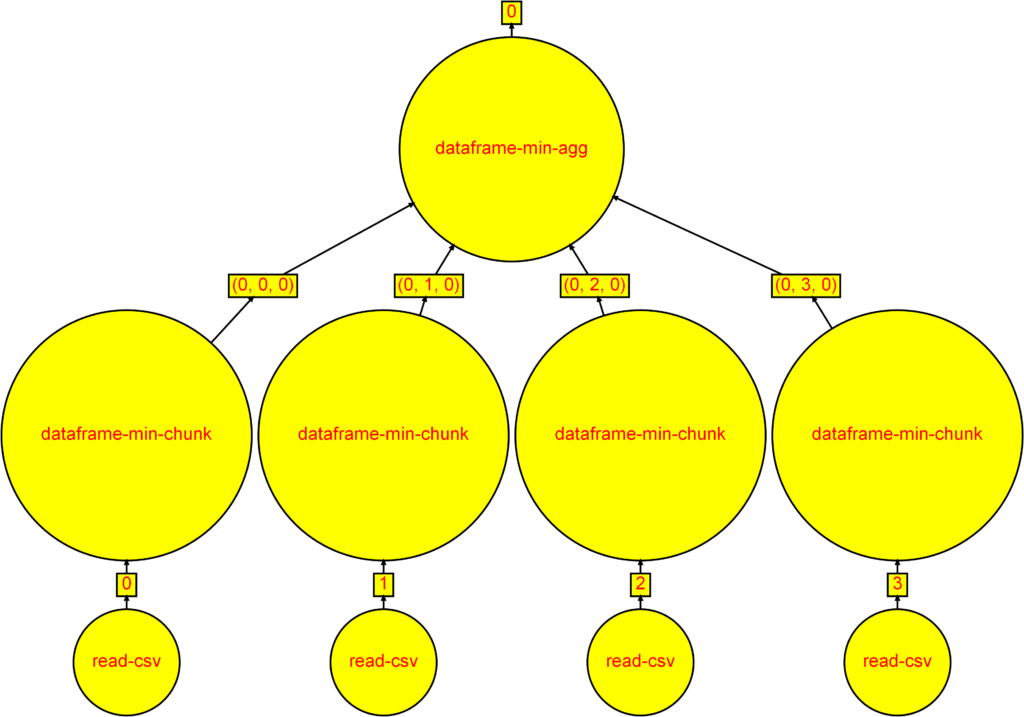
As you can see, we have passed in the attributes for the nodes (the circles and squares) and the edges (the lines connecting the nodes).
These arguments are not mentioned explicitly in the API reference for the .visualize() function. However, they fall under the **kwargs section. These are Graphviz attributes. Apart from node and edge attributes, you can also add graph attributes. You can find the complete list of customizations here.
A couple of points to note:
- Increasing the fontsize (default 14) also increases the size of the shape. In a jupyter notebook, you may not see the difference, as the notebook scales the image to fit in the view port. However, the size and dimensions of the saved image keep increasing.
- All attributes, even numerical, have to be passed as text within the node_attr, etc. dicts (see the fontsize example). If you don’t, you will get the following error:
expected string or bytes-like object- The ‘shape’ attribute doesn’t seem to work. I think that’s because the to_graphviz function in dask sets circle as the default node shape for the tasks, and box as the default node shape for the branch numbers. See the function definition here.
Found this post helpful? Then check out further posts on Python on iotespresso.com. Also, follow IoT Espresso on Twitter to get notified about every new post.
1 comment